A “bad bounce rate” in Google Analytics 4 is subjective, so take any numbers someone gives you with a big grain of salt. (I’m talking Mediterranean sea salt flakes.)
As a reminder, GA4 bounce rate is the percentage of users who visit your site or app and do NOT complete any of the following three actions:
- Spend more than 10 seconds on the site/app
- Visit a second page/screen
- Complete a conversion event
Read more: What is a conversion in GA4?
Because every website is different, a “bad” bounce rate for you may be “great” for someone else, and vice versa.
Content
1. How To Find Your Bounce Rate in GA4
2. What’s a Bad Bounce Rate for My Site?
How To Find Your Bounce Rate in GA4
There are two ways to see your bounce rate in Google Analytics 4:
1. Add bounce rate to your Reports dashboard (this is the option we’re going to use)
2. Add bounce rate to an Exploration
Now that you know where to find bounce rate, we can determine what’s a “bad” bounce rate for your site.
What’s a Bad Bounce Rate for My Site?
Here’s a process I recommend to determine a “bad” bounce rate for your website.
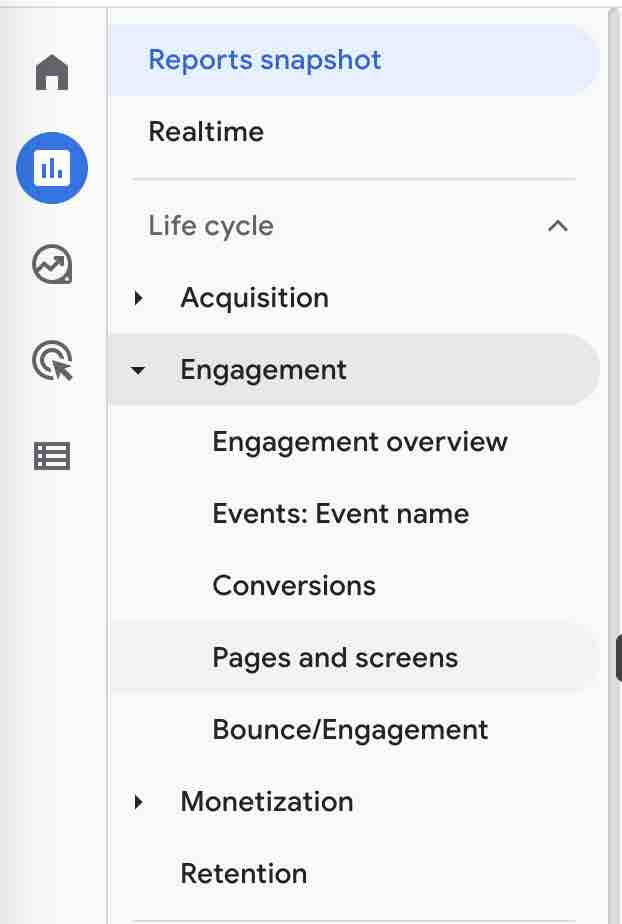
1. Go to the Reports section of Google Analytics 4.
2. Go to Engagement > Pages and screens
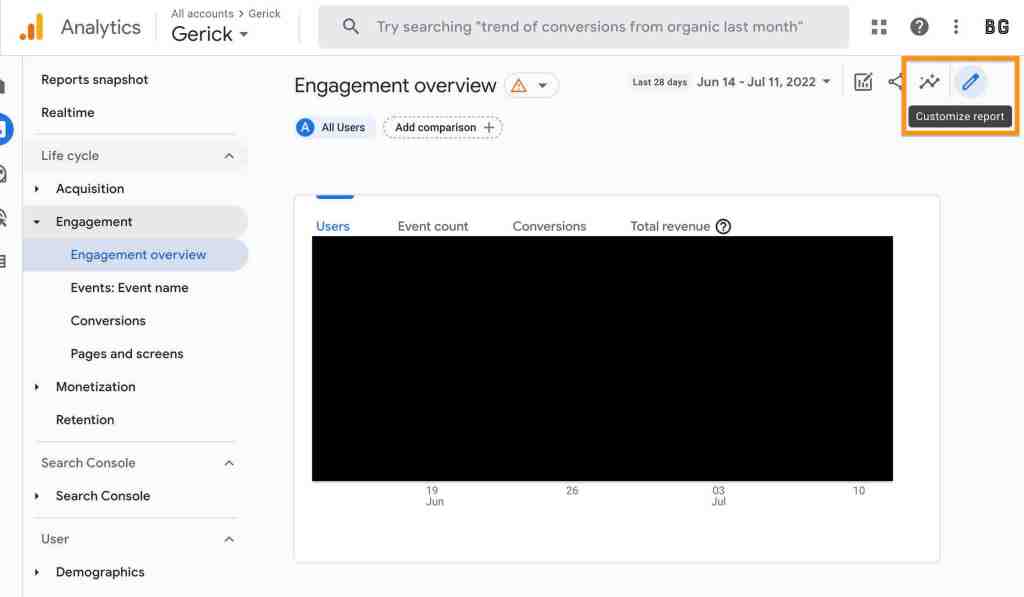
3. Select the Last 28 days in your date range. (You can increase or decrease this depending on your site’s size and traffic, but I think 28 is a good balance between being recent enough, but not too cumbersome.)

4. Click the pencil in the top-right portion of the screen:
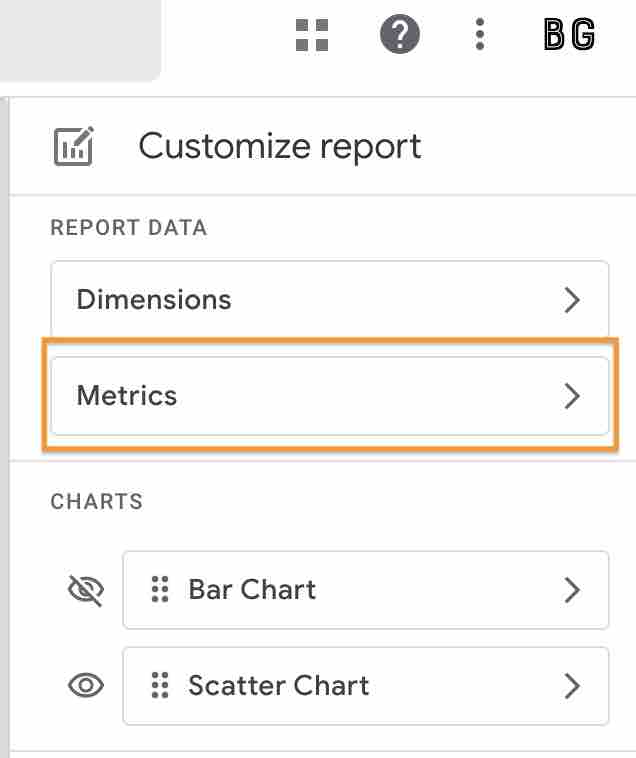
5. Click the > across from Metrics
6. Click the + Add metric button and scroll down to select bounce rate. (In the following screenshot, I have already added it. You probably won’t see it in your list if you haven’t added it yet)
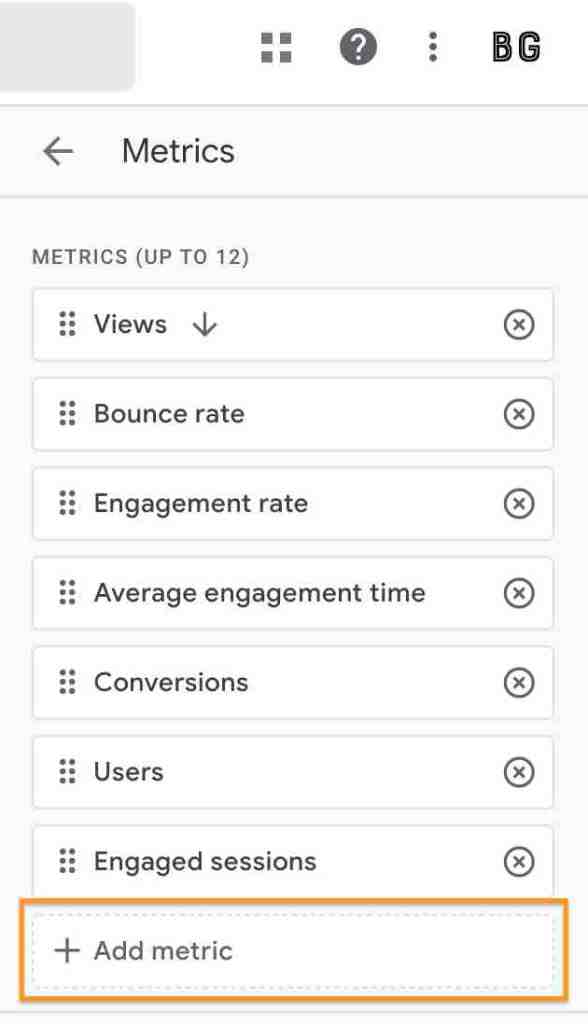
7. Drag the different metrics from top to bottom to order them. The ones up top will appear the furthest to the left in your report
8. Click the blue Apply button
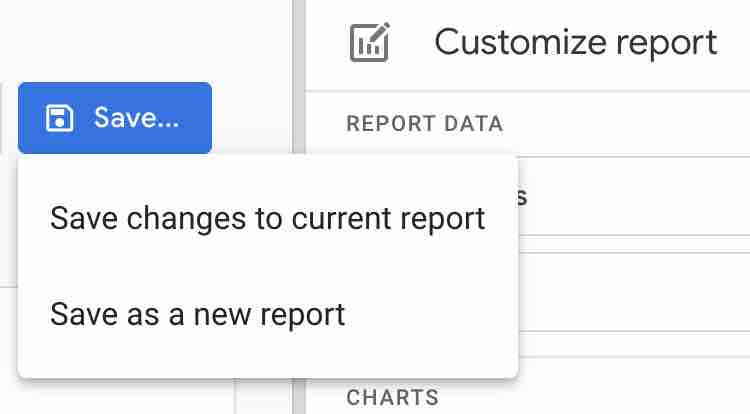
9. Click the blue Save button and choose one of the two options: saving changes to a current report, or as a new report.
You should now see bounce rate in the report you customized. Remember, you can add this (and other custom metrics) to almost any of your Reports in Google Analytics 4.
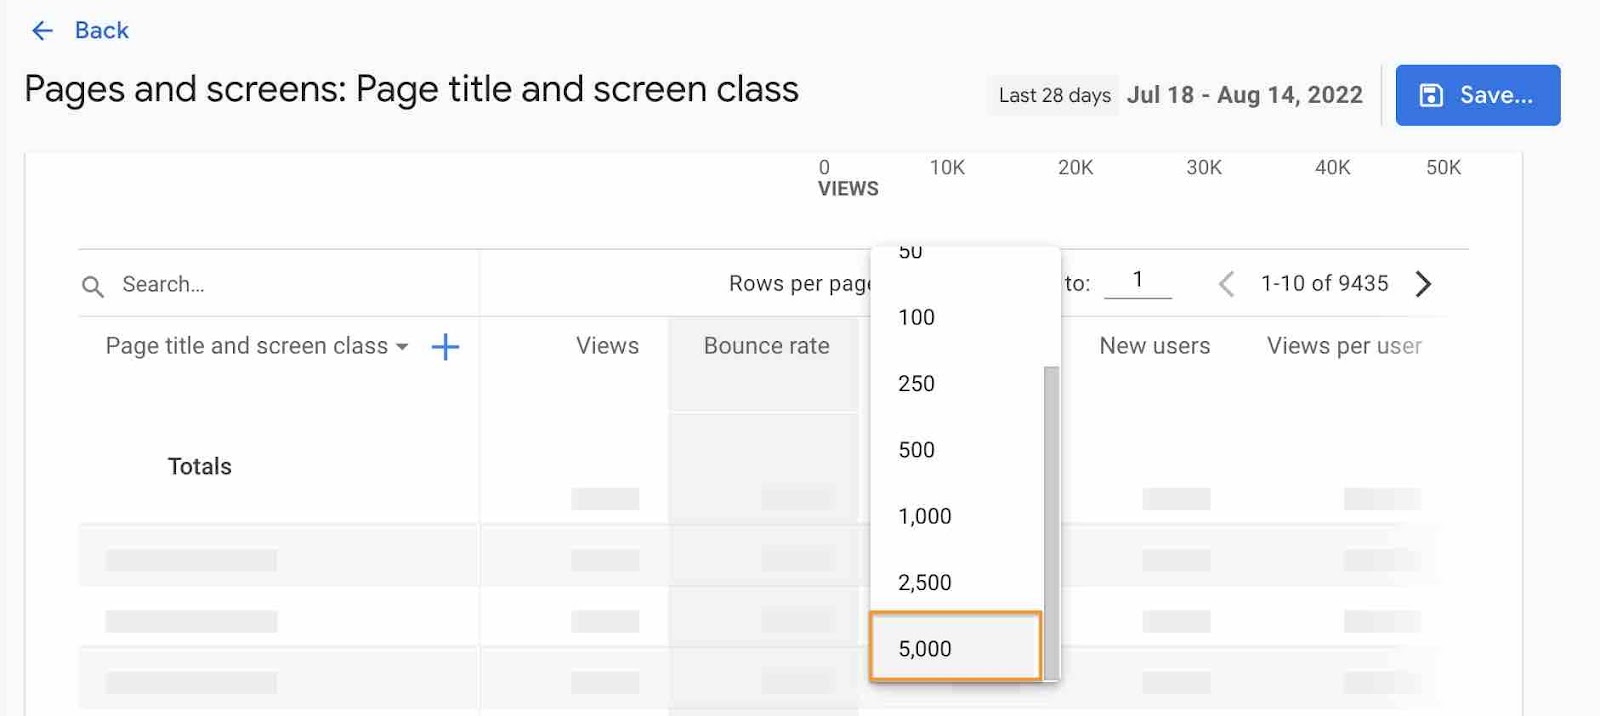
10. Change “Rows per page:” to the maximum of 5,000.
11. Scroll through your list of pages and see which is the last page with at least 28 views*.
*I chose 28 because it means that page is averaging at least one user per day. Depending on how large or small your site is, you can increase or decrease this number.
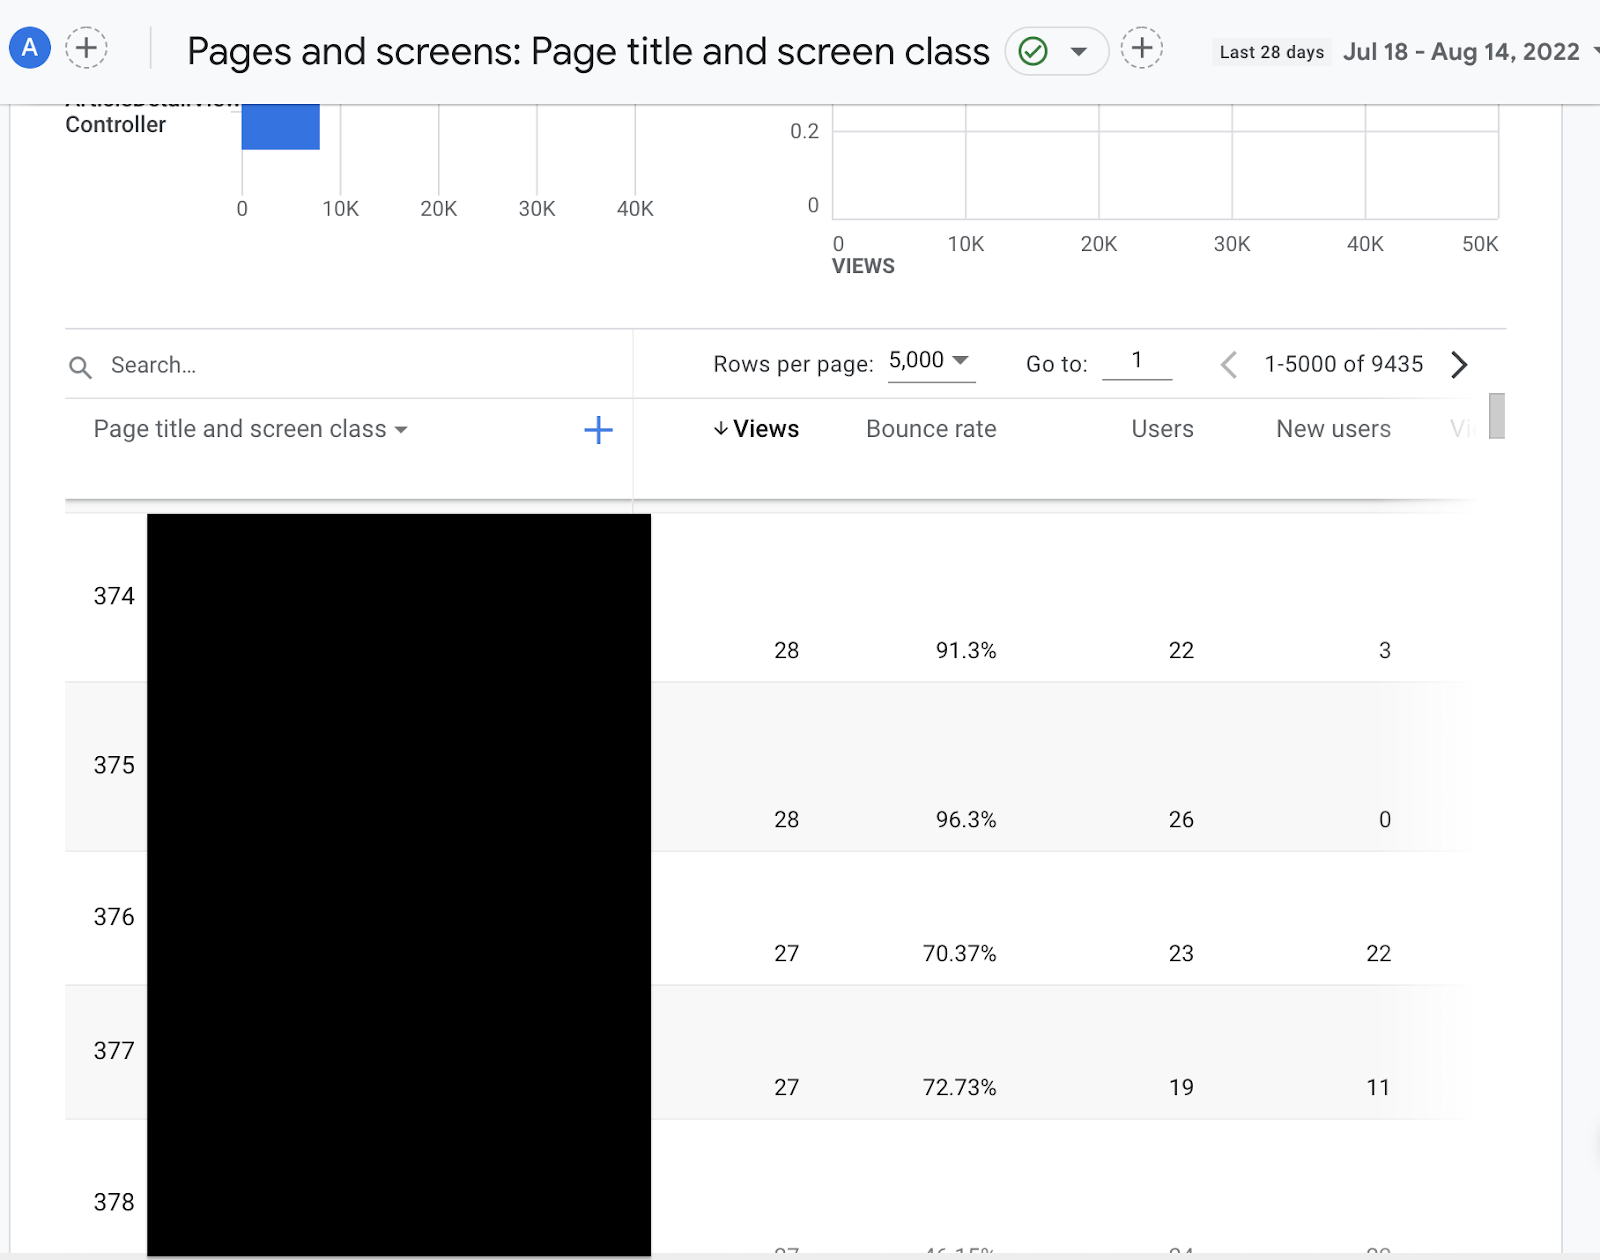
In this case, the first 375 pages in my date range average at least one user per day.
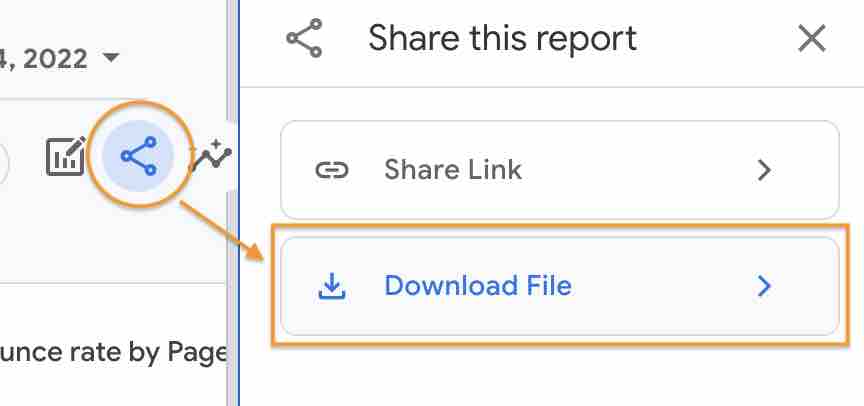
12. Export the file as a CSV.
13. Scroll down to around row 5,000 in the spreadsheet.
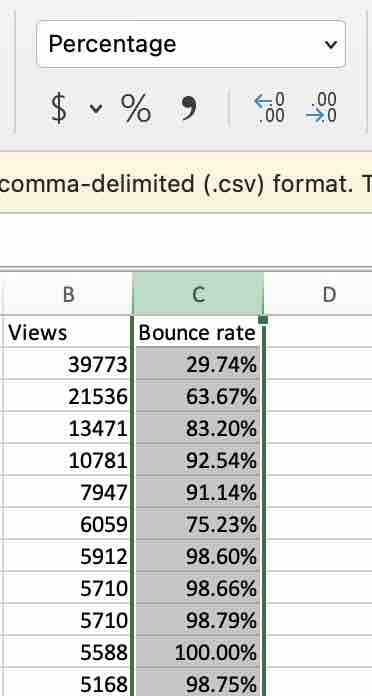
For some reason, the GA4 export does this weird thing where all the columns in the dashboard are not displayed at the top of the spreadsheet. Since we have Views and Bounce rate in our first two columns, we see it as the second “section” of data here, beginning with row 5013.
14. Scroll down to the last row with at least 28 views and delete all the rows below it in this section.
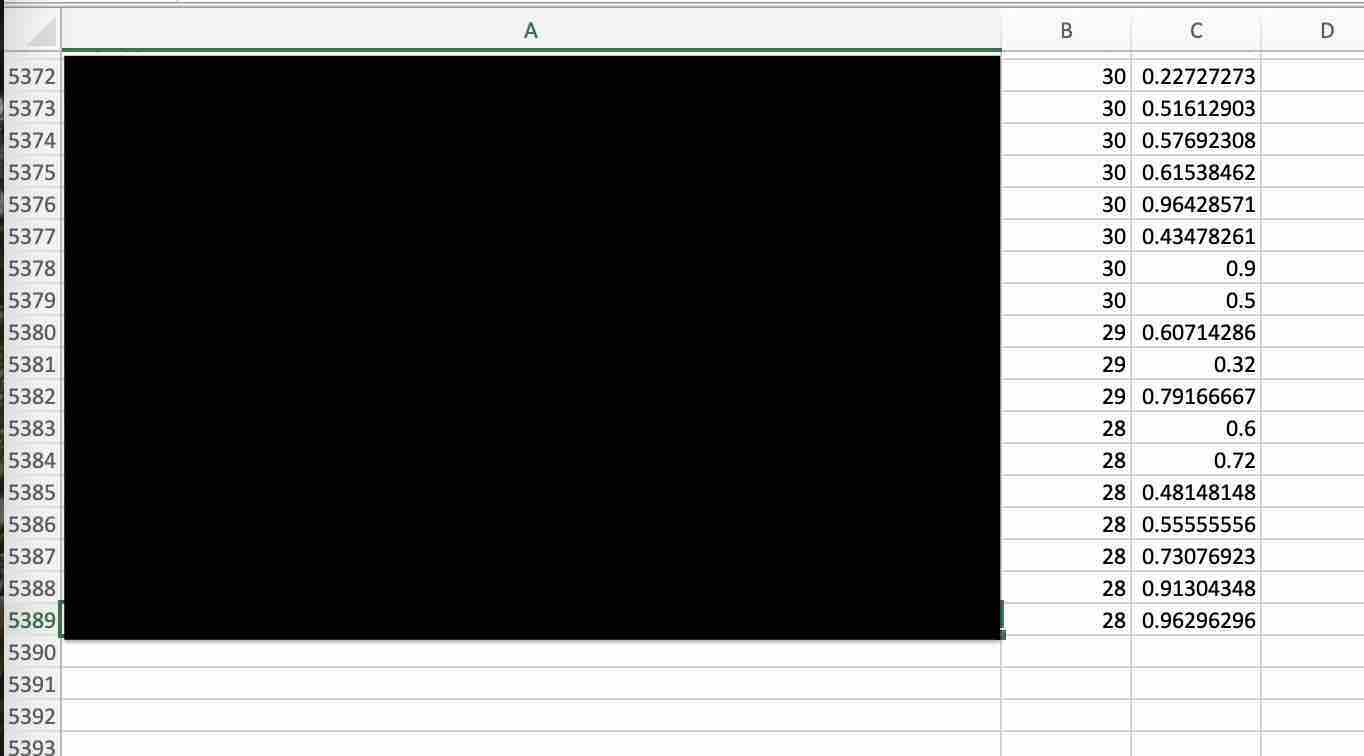
16. Since bounce rate is expressed as a percentage, highlight the entire bounce rate column (column E in our case) and change the cell format to %.
17. Highlight all three columns in this section only – in this case A5015:C5389 – and sort the Bounce Rate column (C) from Largest to Smallest (highest to lowest).
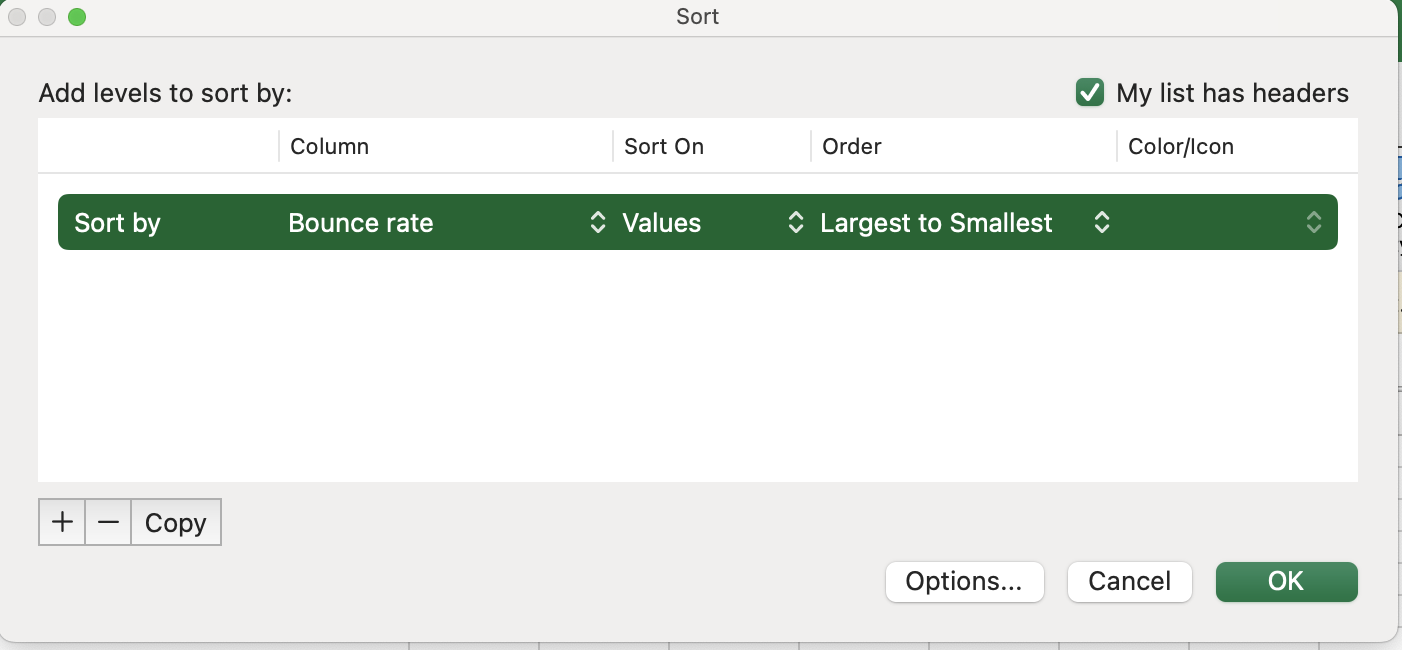
Now we have all the pages on our site that average at least 1 visit per day in the last 28 days sorted from those with the highest bounce rate to the lowest.
18. However many rows (pages) you have in this report, take 50 percent. In our case we have 375 pages. Ten percent of 374 is 187.5. I’m going to round down to 187.
That is going to be our marker for a “bad” bounce rate. All pages from 1 to 187 in the list are a “bad” bounce rate for our site. That means anything at 86.84 percent and above.
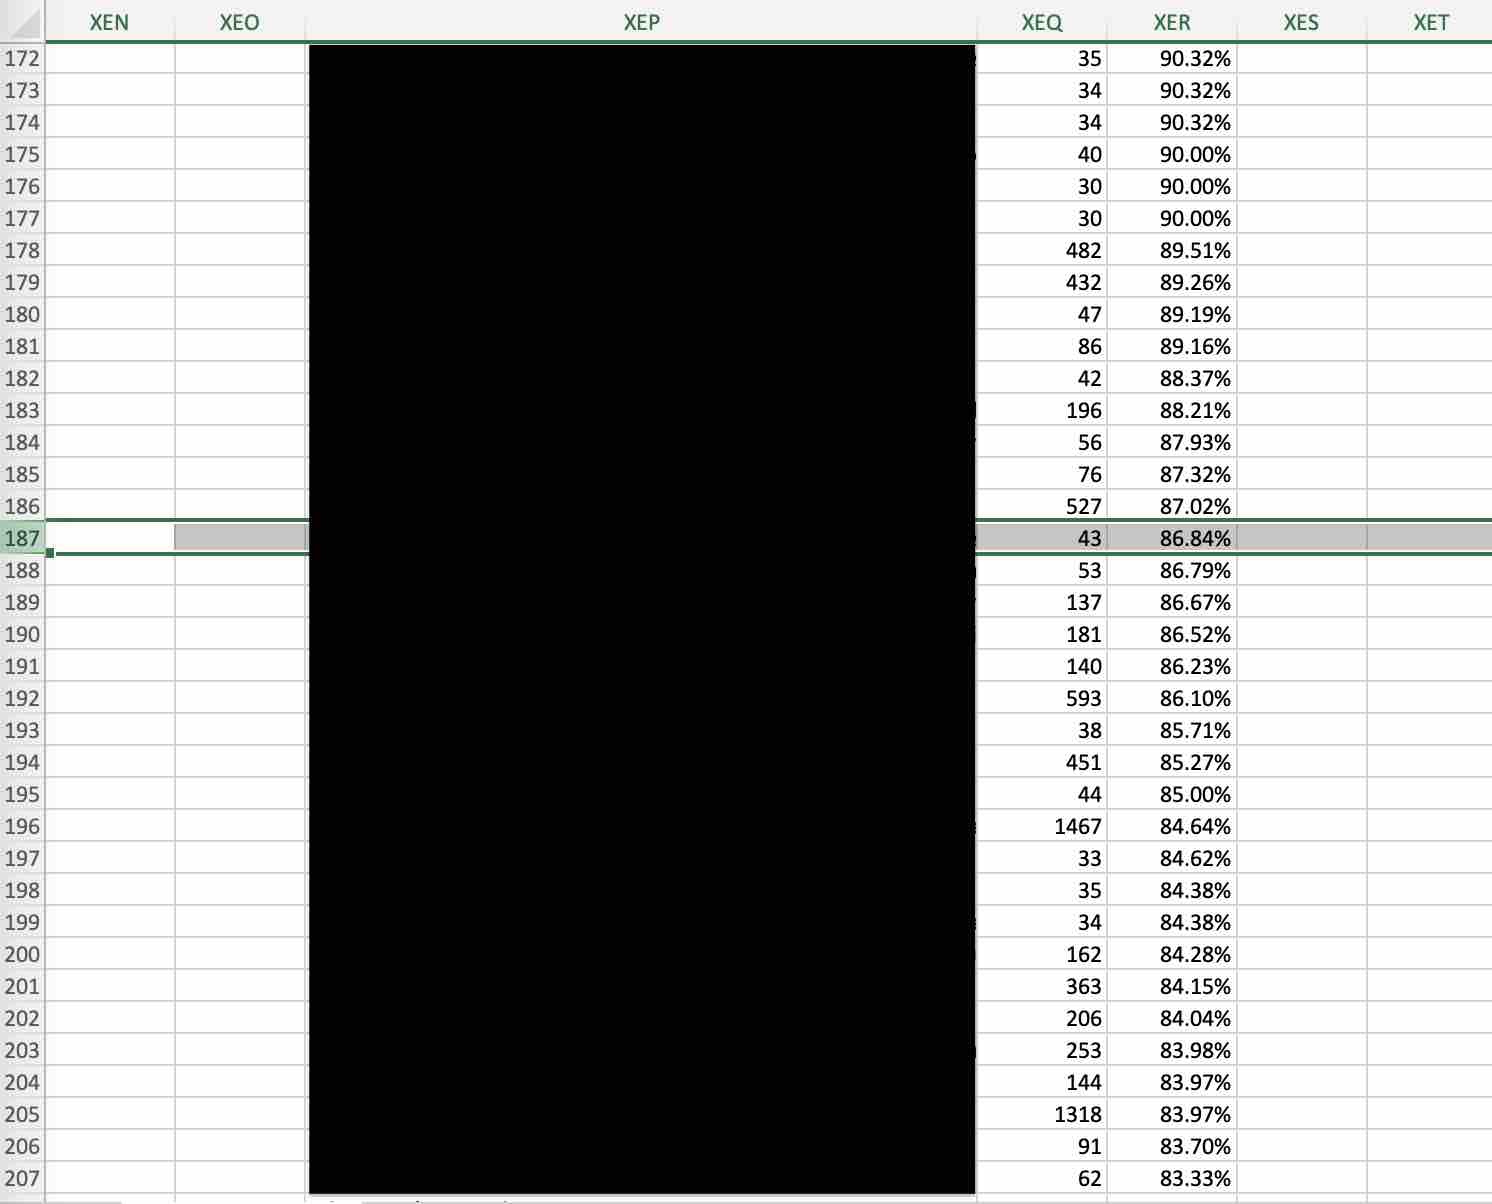
We now have a “bad” bounce rate for our site using Google Analytics 4 data.
Remember, this is how I suggest analyzing bounce rate. You can adjust multiple parts of this process to your preferences, though:
- Change your date range (from 28 days)
- Change your “minimum views” cutoff (from 28)
- Change your cutoff percentage (from 50)
Another way to refine your list is to eliminate pages you don’t want to analyze. e.g. Your homepage, section pages, bio pages, about pages and more.
Next Read: How To Lower My Bounce Rate in GA4
Leave a Reply